FIGYELEM: A régi honlap tartalma már elavult információkat tartalmaz.
Friss információkért kérjük látogasson el a https://jozsefvaros.hu címre!
☰
Friss információkért kérjük látogasson el a https://jozsefvaros.hu címre!

We conducted a research to assess residents’ social status and their views on the measures the municipality has taken.
From autumn 2020 to summer 2021, TÁRKI Social Research Institute conducted interviews, a survey, and focus groups asking residents of Józsefváros, along with the institutions, organizations and experts involved to assess the social status of the district’s population and their opinion on the municipality’s measures.
As part of the research, employees of the municipality and the district’s organizations were interviewed, phone questionnaires were done among the residents of the district, as well as 6 public focus groups were also generated.
This article presents the results of the phone questionnaires conducted among the residents of the district with the participation of 1000 respondents.
Who responded?
The authors of the research strived to design a survey representing the distribution of the population by residential quarters. This means that the ratio of respondents from Palotanegyed should be the same as their ratio in the whole population of Józsefváros. For example, the number of respondents living at Tisztviselőtelep or Ganznegyed is much lower than at Losonci negyed or Corvin negyed because the population of Tisztviselőtelep and Ganznegyed is smaller than of Losonci negyed and Corvin negyed.
So, in figures, 260 respondents lived at Magdolna and Orczy negyed, 260 at Losonci and Corvin negyed, 235 at Csarnok and Népszínház negyed, 161 at Palotanegyed, 62 at Tisztviselőtelep and Ganznegyed and 49 at Százados negyed and Kerepesdűlő at the time of the research. The total number of respondents was 1027.
How long have they lived in the district? | 1–2 years | 6.2 |
3–5 years | 13 | |
6–10 years | 15.5 | |
11–19 years | 16.4 | |
20+ years | 48.9 | |
Type of housing | flat owned by resident (or by a member of the household) | 67.7 |
council flat | 17.7 | |
rented - leased from natural person | 12.5 | |
courtesy use of flat (staying in a natural person’s flat for rent under the market rate or for free) | 2 | |
Title | registered permanent residence (displayed on address card) | 89.5 |
registered place of stay (temporary address, displayed on address card) | 6.7 | |
permanent but not registered place of residence(not displayed on address card) | 1.4 | |
temporary, not registered place of residence (not displayed on address card) | 2.4 |
Table 1 No of residents in the district’s residential quarters and the number of items in the sample
Demographic data (gender, age, education) reflect the 2011 census data. A large part of the district’s population consider their financial situation to be good, a third just make ends meet while a tenth face money problems every month.
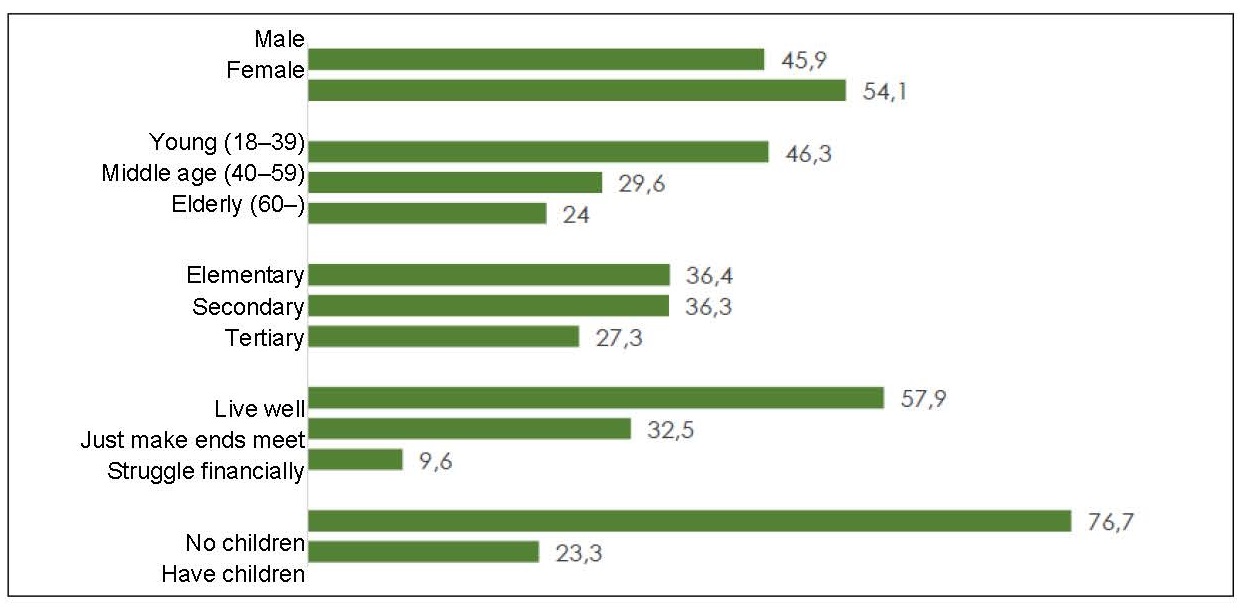
Figure 1 Distribution of effective sample by various demographic variables (%)
Nearly half of the respondents have lived in the district for 20 years or longer, while a fifth have lived there for up to 5 years. Two-thirds live in owner-occupied flats, one-fifth in council flats, 12% rent their flat and 2% live in a flat out of courtesy. Close to 90% of the respondents have their permanent addresses registered in Józsefváros.
|
How long have they lived in the district? |
1–2 years |
6.2 |
|
3–5 years |
13 |
|
|
6–10 years |
15.5 |
|
|
11–19 years |
16.4 |
|
|
20+ years |
48.9 |
|
|
Type of housing |
flat owned by resident (or by a member of the household) |
67.7 |
|
council flat |
17.7 |
|
|
rented - leased from natural person |
12.5 |
|
|
courtesy use of flat (staying in a natural person’s flat for rent under the market rate or for free) |
2 |
|
|
Title |
registered permanent residence (displayed on address card) |
89.5 |
|
registered place of stay (temporary address, displayed on address card) |
6.7 |
|
|
permanent but not registered place of residence(not displayed on address card) |
1.4 |
|
|
temporary, not registered place of residence (not displayed on address card) |
2.4 |
Table 2 Distribution of district residents by different housing-related questions(%)
Opinions on public affairs, developments and plans in the district
In the research, residents of Józsefváros were asked whether they consider things going in the right or wrong direction in Hungary, in Budapest and in the district. Overall, in all three cases the average of scores were similar on a 0–10 scale, they were mostly average, or slightly under average. Respondents rated the situation in Józsefváros at an average score of 4.98, at 4.94 in Budapest and at 4.59 regarding national issues.
As for Józsefváros, respondents with a higher educational background and those in better financial situation evaluated the situation to be slightly better in the district. Opinions differ by location as well: residents of Magdolna and Orczy negyed evaluate the development of district affairs far worse than those who live for example at Tisztviselőtelep or Kolónia.
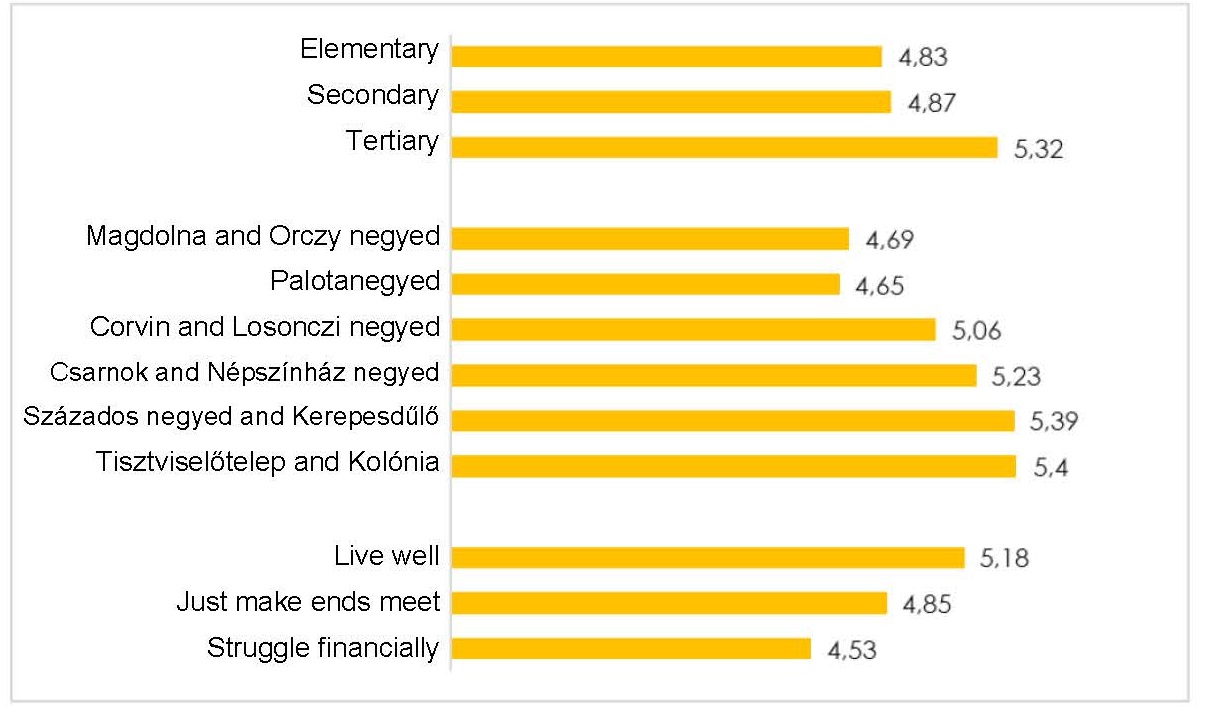
Figure 2 Overall do you things are going in the right or wrong direction in Józsefváros? (average)
A relative majority of respondents believe that “during the crisis the government punish opposition-led municipalities by the reduction of funds”, while one-quarter thinks that “the reduction of funds is legitimate because municipalities should contribute more to the management of the crisis”. Related to this question, half of the people think “the government must compensate all municipalities to the same extent due to governmental funding lost” and almost a quarter of them believe “the government have the right to decide which municipalities lose more funding”.
|
Proportion of agreement (%) |
|
|
The government punish opposition-led municipalities by the reduction of funds during the crisis. |
49.5 |
|
The reduction of funds is legitimate, because municipalities should contribute more to the management of the crisis. |
25.7 |
|
neither |
14.7 |
|
NA |
10.2 |
|
The government must compensate all municipalities to the same extent due to governmental funding lost. |
55.6 |
|
The government have the right to decide which municipalities lose more funding. |
24.7 |
|
neither |
10.4 |
|
NA |
9.3 |
Table 3 Opinions on municipalities losing funding (%)
It has been found in the study that most people of Józsefváros like the district: 87% of the adult population have said they like living in the district, while 13% do not.
As for the question of moving, the research has shown that “although the residents of the district clearly like living in the district, half of the residents of Józsefváros would consider moving. A good quarter of respondents (27%) would move if had the opportunity, while one-fifth (20.6%) have already considered it. All in all, a narrow majority of district residents (52.2%) would not move.

Figure 3 Would you move to another location if you had the option? (%)
Opinions on public services in the district
Satisfaction with public services is high in general, of the areas surveyed, the relative majority of residents in Józsefváros are only dissatisfied with public safety and the temporary home provided for children.
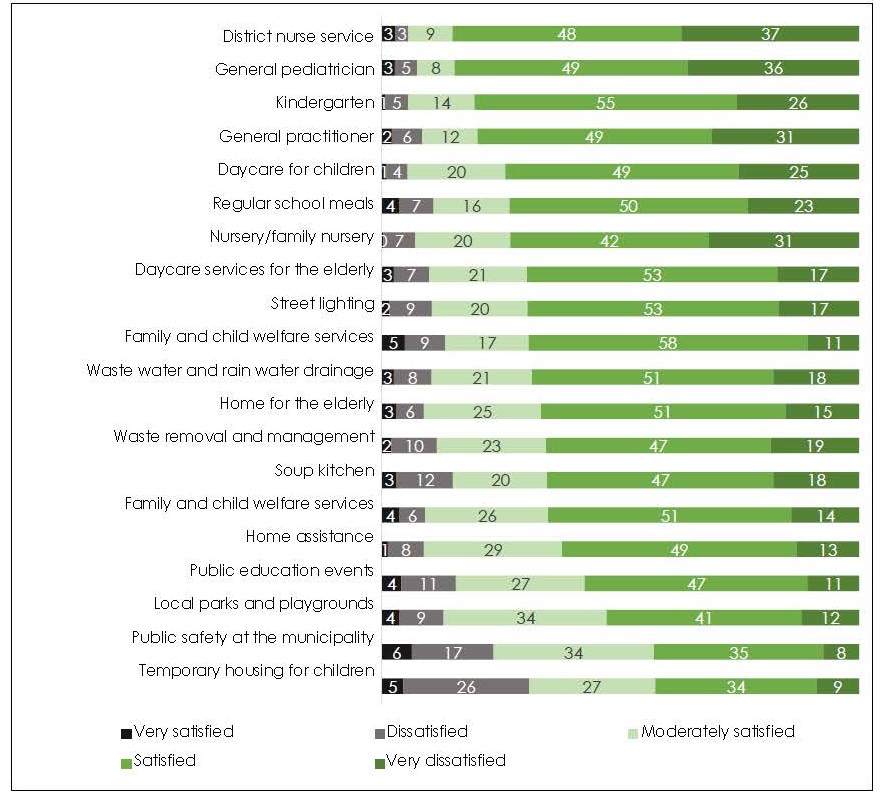
Figure 4 Assessment of public services in the district
Residents’ opinion in Józsefváros about some changes and plans in the district
The research examined the assessment of various areas being the responsibiliy of the municipality. Except for one area, the relative majority of residents believe the situation has not changed. 63% of the residents believe cyclists’ possibilities have improved, 40% believe the condition of parks and playgrounds is better, 30% believe the quality of costumer service and the involvement of residents has improved and 25% think the work of the public safety office has improved. As for corruption, welfare support and public cleaning however, almost one-third of the respondents feel the situation has got worse. It should be noted with respect to corruption and welfare support, that the proportion of those who could not decide was very high (33.2% for corruption, 43.5% for welfare support), and as such the distribution of opinions includes the evaluation of fewer respondents, namely of those who did have an opinion about these matters.
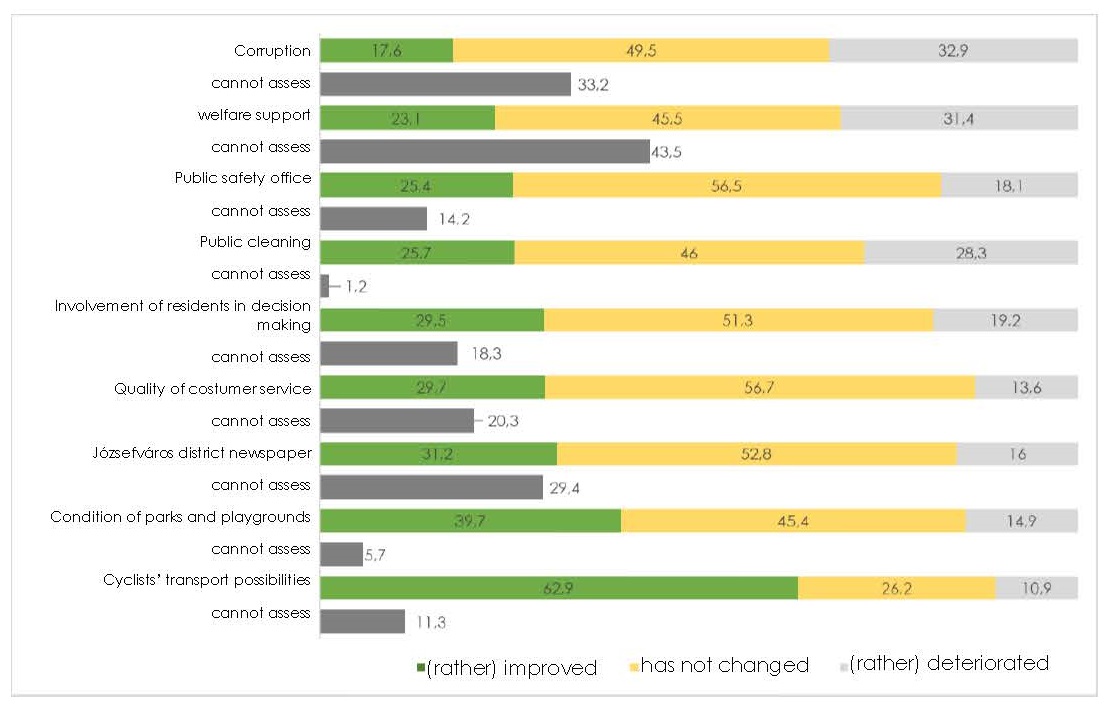
Figure 5 Public assessment of changes of various areas being part of the responsibilities of the municipality (%)
Assessment of specific measures taken recently
Respondents also evaluated specific measures taken by the András Pikó-led municipality. Each measure was supported by at least two-third of the residents, but for example green public tenders and the procurement of a new street cleaning machine was supported by 90–90%, a lower price for soup kitchens and European Union funding for kindergartens were supported by 85–85%, and pandemic-related aid by the district along with the introduction of a wage subsidy scheme was supported by 82–82%. On the other hand, the four least supported measures were the creation of a new civil strategy (63%), the development of bike lanes (67%), transformation of the district’s housing application system (72%) and adoption of the district’s anticorruption strategy (74%).
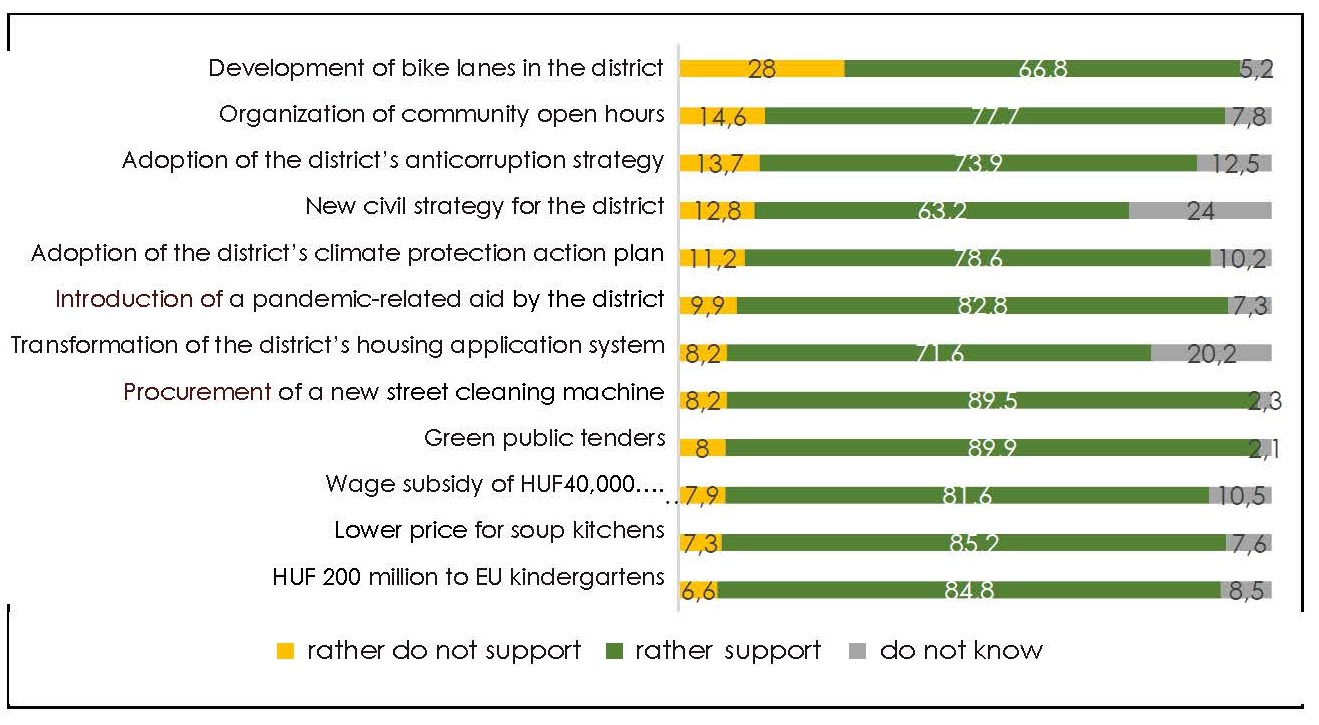
Figure 6: Support of specific measures taken by the municipality (%)
Residents of Józsefváros would prefer more municipal funding for the expansion and maintenance of green areas (89%), the improvement of public safety (82%) and the improvement of local health care institutions (81%).
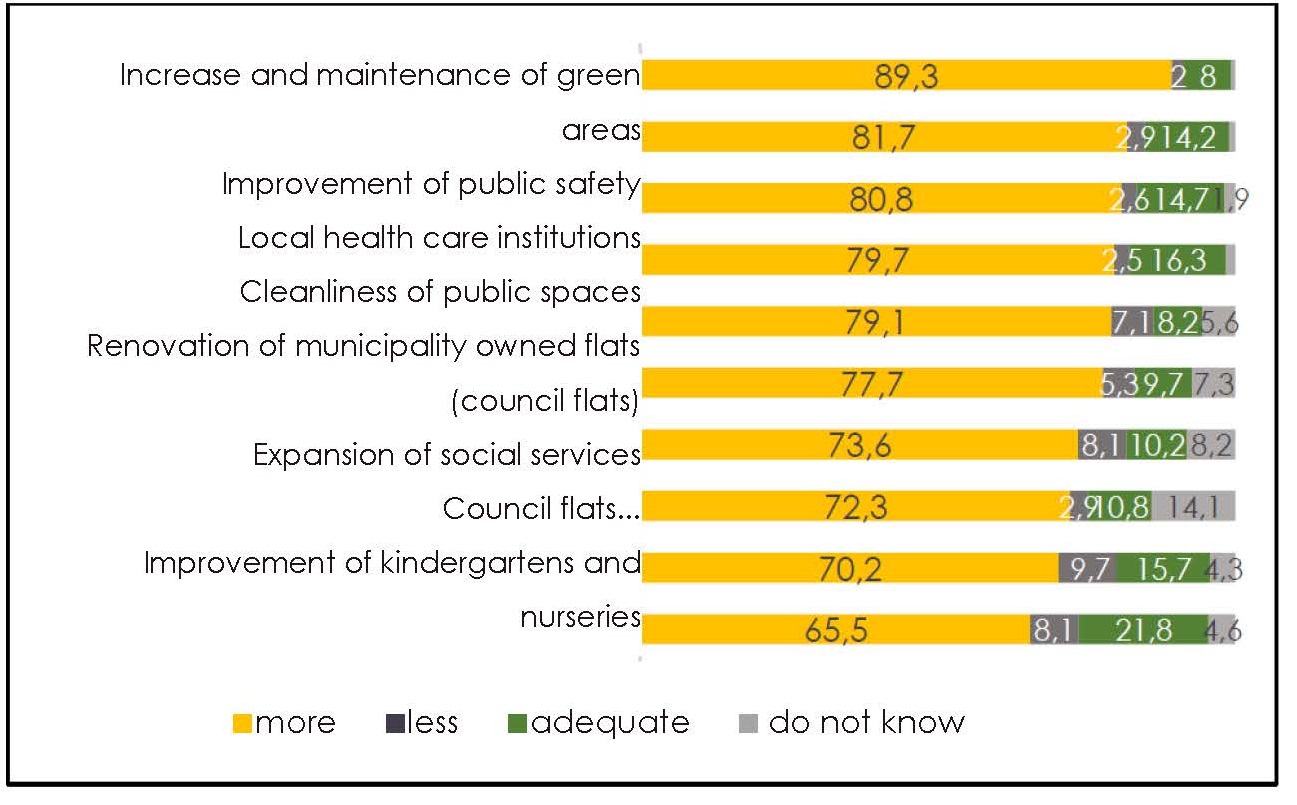
Figure 7 Support of increase or reduction of funding for various measures (%)
Assessment of the development plans in Józsefváros
The research has studied how residents of Józsefváros assess future plans (at the time of the study). Some of these plans are already in progress. The majority of Józsefváros residents consider the renovation of Blaha Lujza tér of highest importance (53%), followed well behind by the renovation of council flats (40%) and the development of local health care institutions (38%).
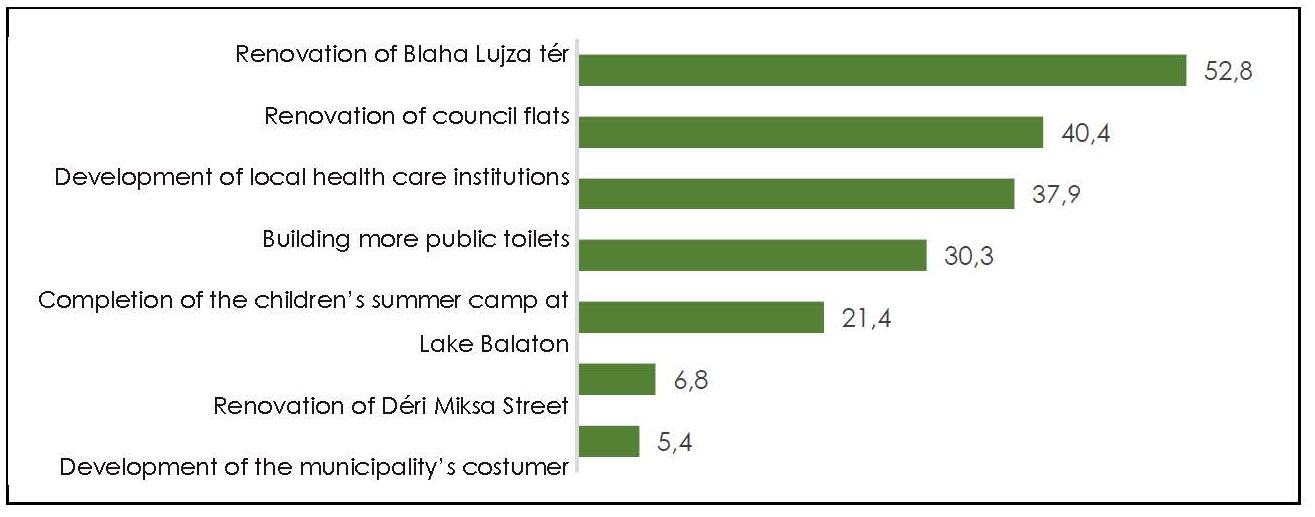
Figure 8: Planned developments in order of importance (%)
More green areas or more parking places?
In the survey, when asked whether they wanted more green areas or parking places, the vast majority of residents preferred more green areas and cleaner air in the district (66%), while 28% would prefer to have more parking places and 6% did not answer.
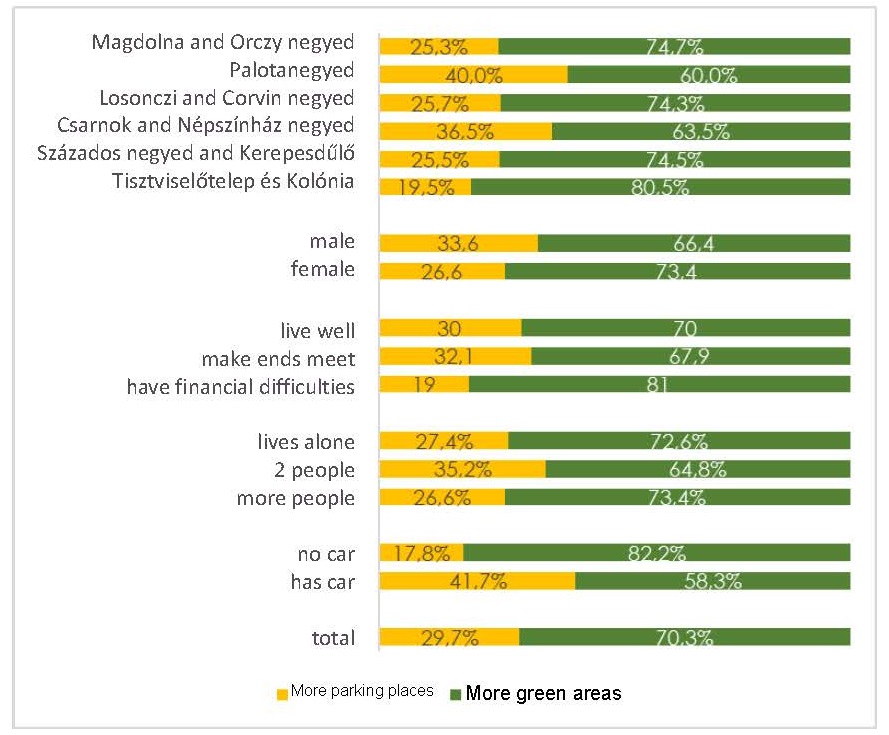
Figure 9: Support for increasing the number of parking places and green areas among various social groups
Residents of Józsefváros could also assess the solutions proposed for parking related problems. The most supported solution is a “complex parking system which considers various parking needs” (72%). Out of the specific plans, the least popular one was that “parking permits would not be automatically valid for the second car of the household” (supported by 53%), while the most supported plan was to terminate free parking currently available for local residents offering them parking at a fair price instead (61%).
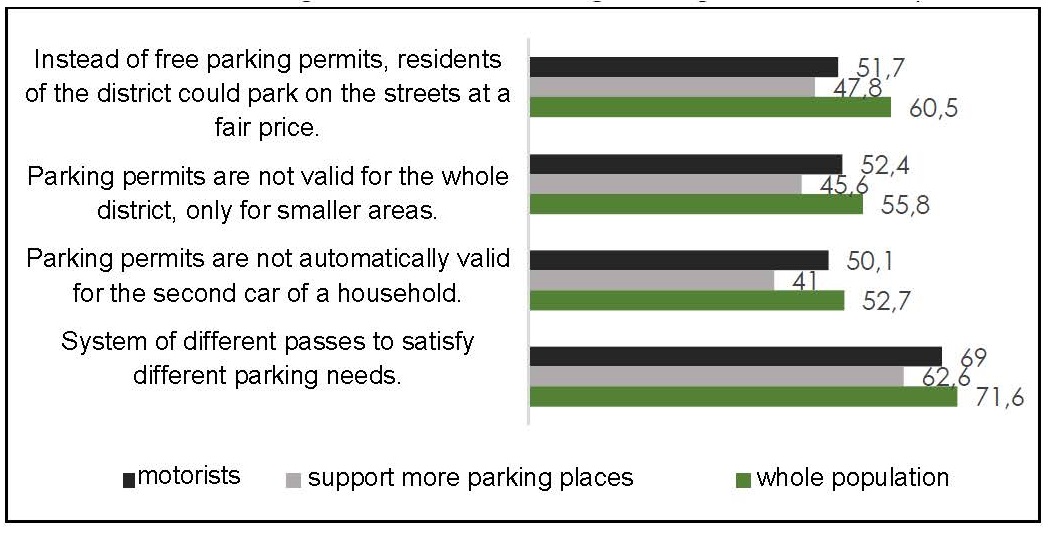
Figure 10: Support for different plans to solve parking problems by various groups
Access to information and participation among residents of Józsefváros
The research has surveyed local people’s habits about obtaining information and their willingness to participate in the public affairs. Most people obtain information at least occasionally at local infospots or posters displayed at public places (72%). The second most popular source of information is Józsefváros Újság, which is read by two-third of the district’s population regularly or occasionally (64%). Almost half of the population get information from the municipality’s website, while one-third use the Facebook pages of the municipality or the Mayor’s Office.
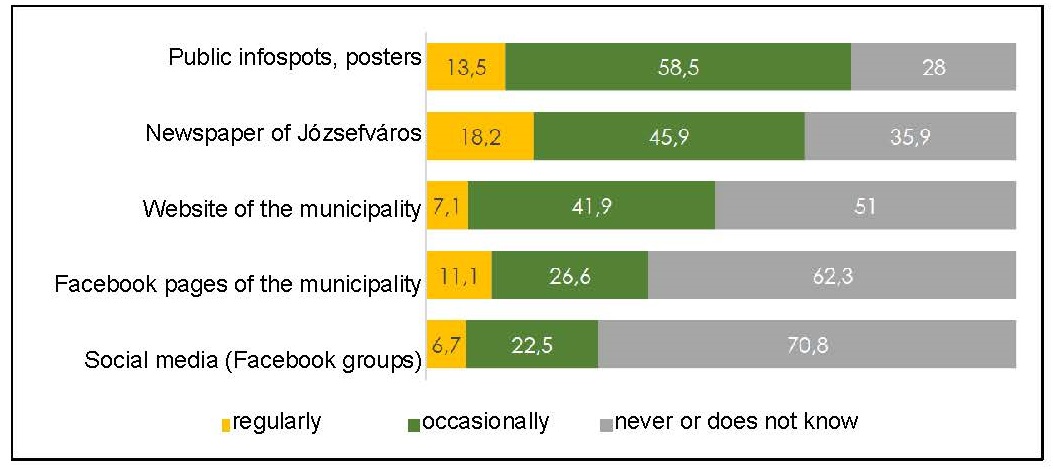
Figure 11: Frequency of sources of information on district matters (%)
The majority of the people of Józsefváros are satisfied with how the municipality involve the residents in decisions about the district (61%), four out of ten (39%), however, feel rather dissatisfied with the involvement of residents. The level of satisfaction varies considerably by age groups: 63% of young people are rather satisfied while this ratio among people over 60 is only 53%. Moreover, a slightly higher than average proportion of people living in difficult conditions also feel left out of decisions (52%).
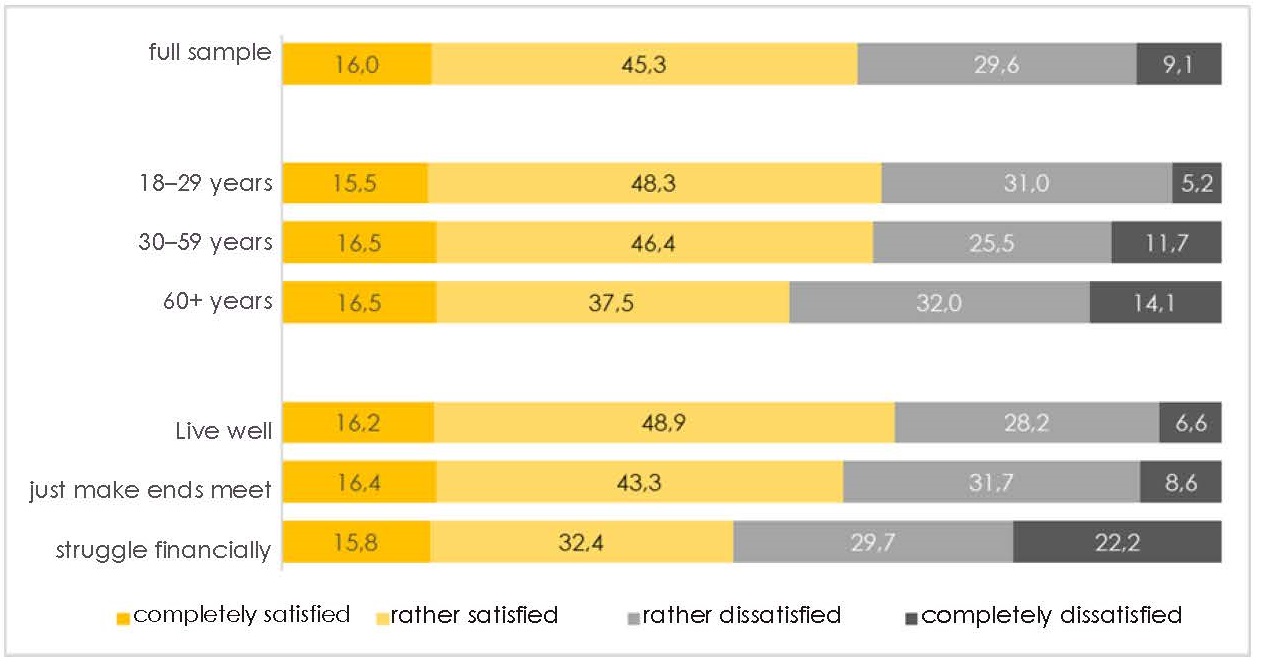
Figure 12: “How satisfied are you with the way Józsefváros Municipality involve residents in decision making affecting the district? (%)
As for the assessment of possible involvement, it is clear online solutions seem to be slightly more popular compared to personal or offline methods. The residents of the district least prefer to have their say in public affairs by answering questionnaires sent in newsletters (56%) or by filling in paper based ones. (52%).
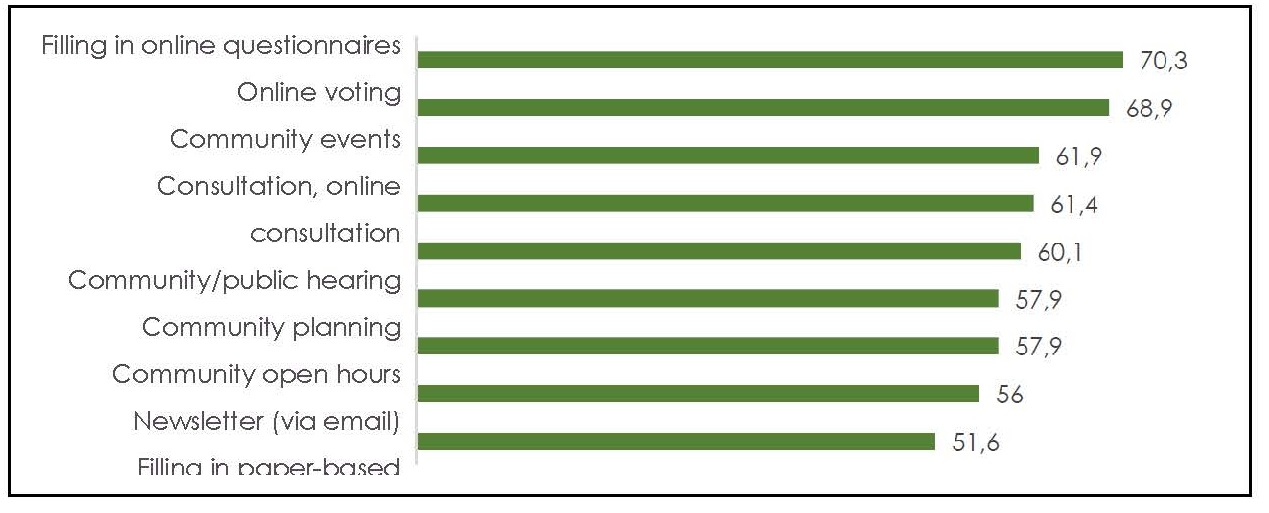
Figure 13: Popularity of various options of involvement of residents (%)
Community activity
As for community activities, it has been found that most residents help their neighbours or friends who live in their immediate neighbourhood in one or another way. (61%). 14% of the district’s residents volunteer while 6% are members of some NGO’s.
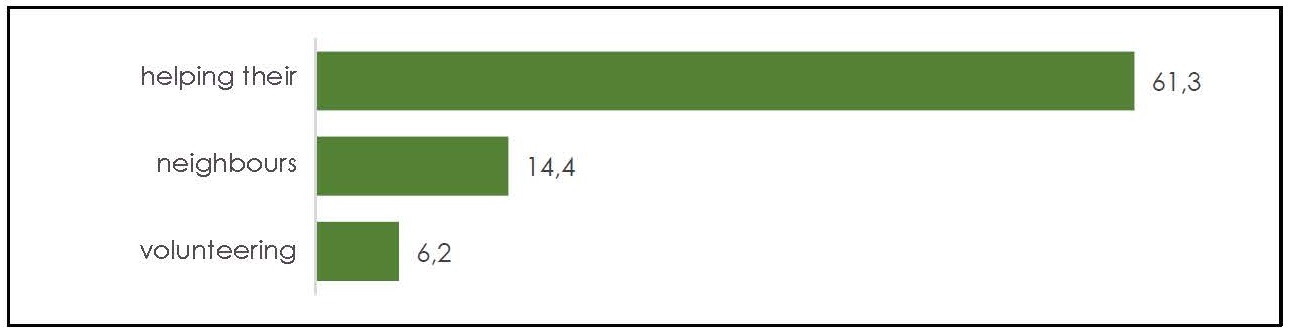
Figure 14: Frequency of various community activities (%)


